HABStats
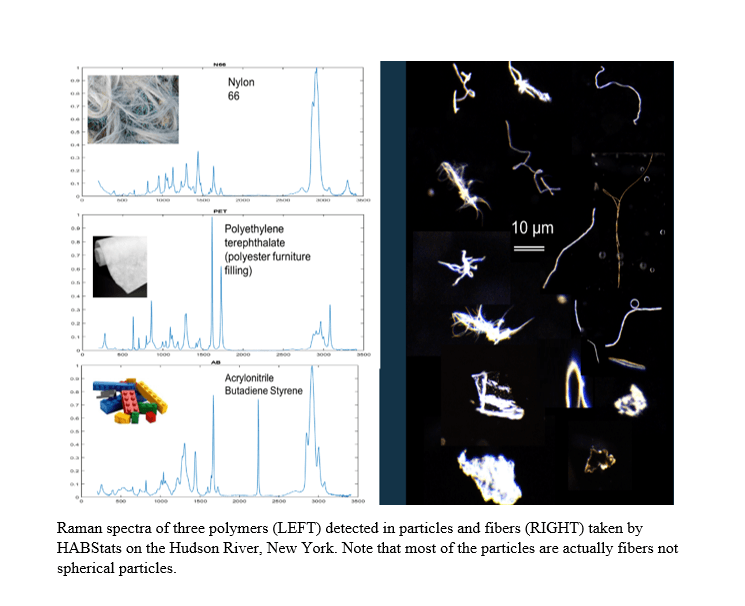
HABStats is a Raman Imaging Flow Cytometer. Like a conventional Flow Cytometer, it has a flow cell where cells and particles between 1 and 500 µm flow past an interrogation window where a laser (532 nm) is triggered to expose the target for a few milliseconds while the fluorescence signal is captured by a spectrometer. HABStats also has a white light imaging system that captures a color image of the target at the same time the laser excites it. In addition to fluorescence information, the Raman shift of light reflected by vibrating molecules is captured by a series of dichroic filters and a sensitive spectrometer. The Raman spectrum from a single target represents a molecular fingerprint of a given compound. Single species of algal cells or microplastic particles emit a specific spectrum that is related to its chemical composition and can be species-specific or polymer-specific. Some Harmful Algal Bloom (HAB) toxins such as microcystin-LR, Domoic Acid and Saxitoxin, may be discriminated, classified and quantified by HABStats
-
![]()
City skyline
Photo By: John DoeButton

Target Features
Features of each target are extracted such as color, shape, texture and morphology (size, minimum/maximum axes, area, volume, perimeter, equivalent spherical diameter and fractal index) and stored in a database along with timestamp.
Dataset Management
Data produced by HABStats include images of targets (algal cells or colonies and microplastics) and their Raman and fluorescence spectra. The combination of the Raman and fluorescence information is digitized into a barcode and stamped on the image of that target. The combination of the image and its barcode is sent to a Convolutional Deep Learning Neural Network (CDLNN) that has been trained to identify the target. New targets may be trained by adding their data to a new class and building a new CDLNN model. A HAB and plastic library of spectra are also used to identify unknown particles.

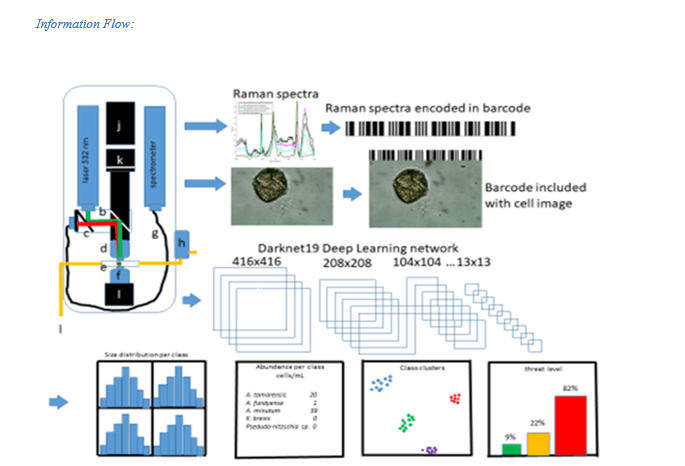
Single cells, colonies or particles are pumped through a flow cell where they intersect the laser fluorescence and Raman scatter. The Raman signal is separated from fluorescence by dichroic mirrors and the Raman signal passed to the spectrometer and encoded into a digital bar code. Meanwhile, a while light image is captured by the 12Mp camera illuminated by a 2µs xenon strobe lamp. The image is stamped with the Raman bar code, stored, and run through a AI classifier that has been trained on images and bar code of specific species, toxins and plastics. Morphological properties of the particle are extracted using machine vision techniques and all data are time stamped and stored. Plots are updated as the user selects specific characteristics such as by class size distribution, shape, perimeter, etc.
For long time series deployments, time series plots provide concentration by class binned by min, hour, day, month or some other time component. For single event-driven experiments a report can be generated providing all of the statistics for a given experiment or combination of cells or particles.


VIEW OUR GALLERY
Images collected across various CPICS, HabCam and OceanCube deployments around the world.